
Dashboards have become an essential tool to support many business functions. Today, you can find dashboards included with most ERP and business process software such as CRM and HR. A dashboard is often the first thing that is shown after someone logs into a system.
So, what is a Dashboard?
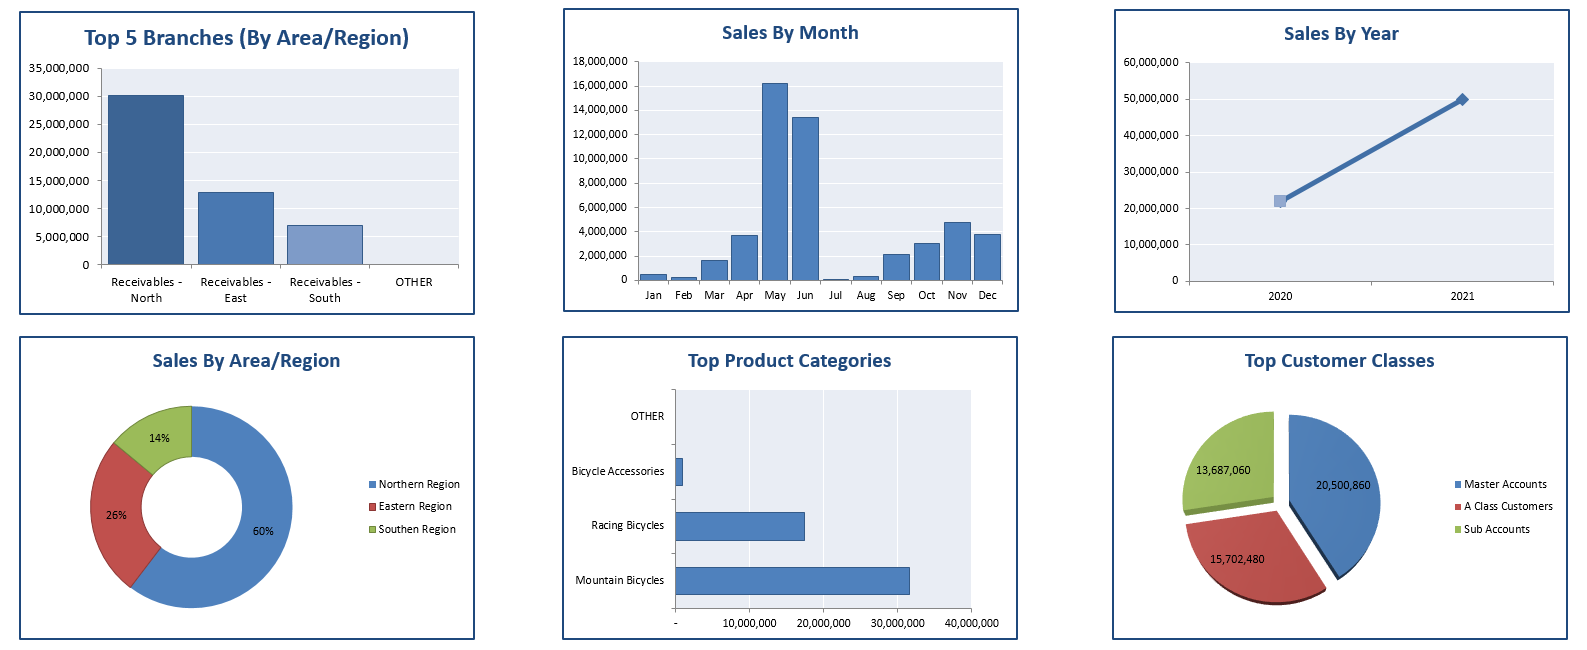
The basic purpose of a dashboard is to provide key decision makers with a graphical representation of vital information. The dashboard will often include Key Performance Indicators (KPIs) and visuals such as speedometers, pie charts, and graphs, all in an easily digestible form. The information is presented in a way that is quickly and easily understood and may be color-coded to indicate areas that may require further exploration or analysis or that are performing optimally. A dashboard is always a summary of a larger report or data set. Usually, it is necessary to drill into the larger data set for further analysis and insight, especially into problem areas. Having the ability to connect related information, view details, gain insight, and answer questions on your own should be an essential part of any dashboard tool.
There are many tools and approaches to dashboards. Some tools are free, some are web-based, and some come with the ERP they support. For stand alone dashboard tools, you have many choices. However, one great option that is easy to use is Microsoft Excel®.
Why Excel®?
Excel® is user-friendly and has great graphing and charting capabilities. This makes it an ideal presentation solution for many organizations. Plus, Excel® is easy to use and is still used by most organizations. There is also a wealth of information on Excel® available online for free. On their own, Excel spreadsheets will usually include the data that the dashboard has summarized. This means that the data that needs to be drilled into for deeper analysis will be simple to reach.
However, Excel® on its own, is not perfect. Connecting to the data source has often been tricky with Excel®-based solutions. IT involvement is usually required to find and connect the data, and this process is often painstakingly slow. Although, Microsoft® has been trying to make it easier to access and report on information in Excel with their popular Power Pivot Tool and SSRS.
How does Vivid help?
Dashboarding solutions, like Vivid Flex, make it even easier to build Excel®-based dashboards and reports. With Vivid Flex, you have complete control over the connections to your data sources. You can also create a single dashboard connected across many systems. Additionally, Vivid Flex enables you to use Excel® much like a web browser without having to keep all of your data in Excel. This means your data is more secure, Excel® files are small or empty, and only the data you need is retrieved and shown. Vivid Flex also enables normal Excel charts to become interactive, allowing you to click on your chart and immediately see the details or a related visual.
Continually, Flex improves on Excel® with its abilities to publish Excel® dashboards to the web and to schedule and automate report distribution. Vivid Flex is also designed with non-technical staff in mind. No matter your level of technical expertise, you can develop reports and dashboards using our Designer and Library of report definitions.
To learn more about Vivid Reports’ Excel®-based dashboard solution, please contact us.
Share: