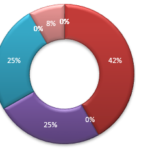
Data visualization is a powerful tool for transforming complex data into actionable insights, and Vivid Reports is your gateway to creating visually compelling and informative reports. In this blog post, we’ll explore the dos and don’ts of data visualization using Vivid Reports, providing valuable tips and techniques to help you craft reports that resonate with […]
Tag Archives: data visualization
Mastering Data Visualization: Dos and Don’ts with Vivid Reports
Don’t Forget About Financial Reporting…

Graphs, charts, traffic lights, thermometers, spinning monkeys, you name it. We are a visual species, and the seemingly endless onslaught of data visualization BI tools would suggest that we are becoming even more accustomed to making business decisions with the help of pretty pictures. I don’t mean to diminish the value of these types of […]
The Case For Excel-Based Dashboards

Dashboards have become an essential tool to support many business functions. Today, you can find dashboards included with most ERP and business process software such as CRM and HR. A dashboard is often the first thing that is shown after someone logs into a system. So, what is a Dashboard? The basic purpose of a […]


