

1. Most people are familiar with Microsoft Excel®
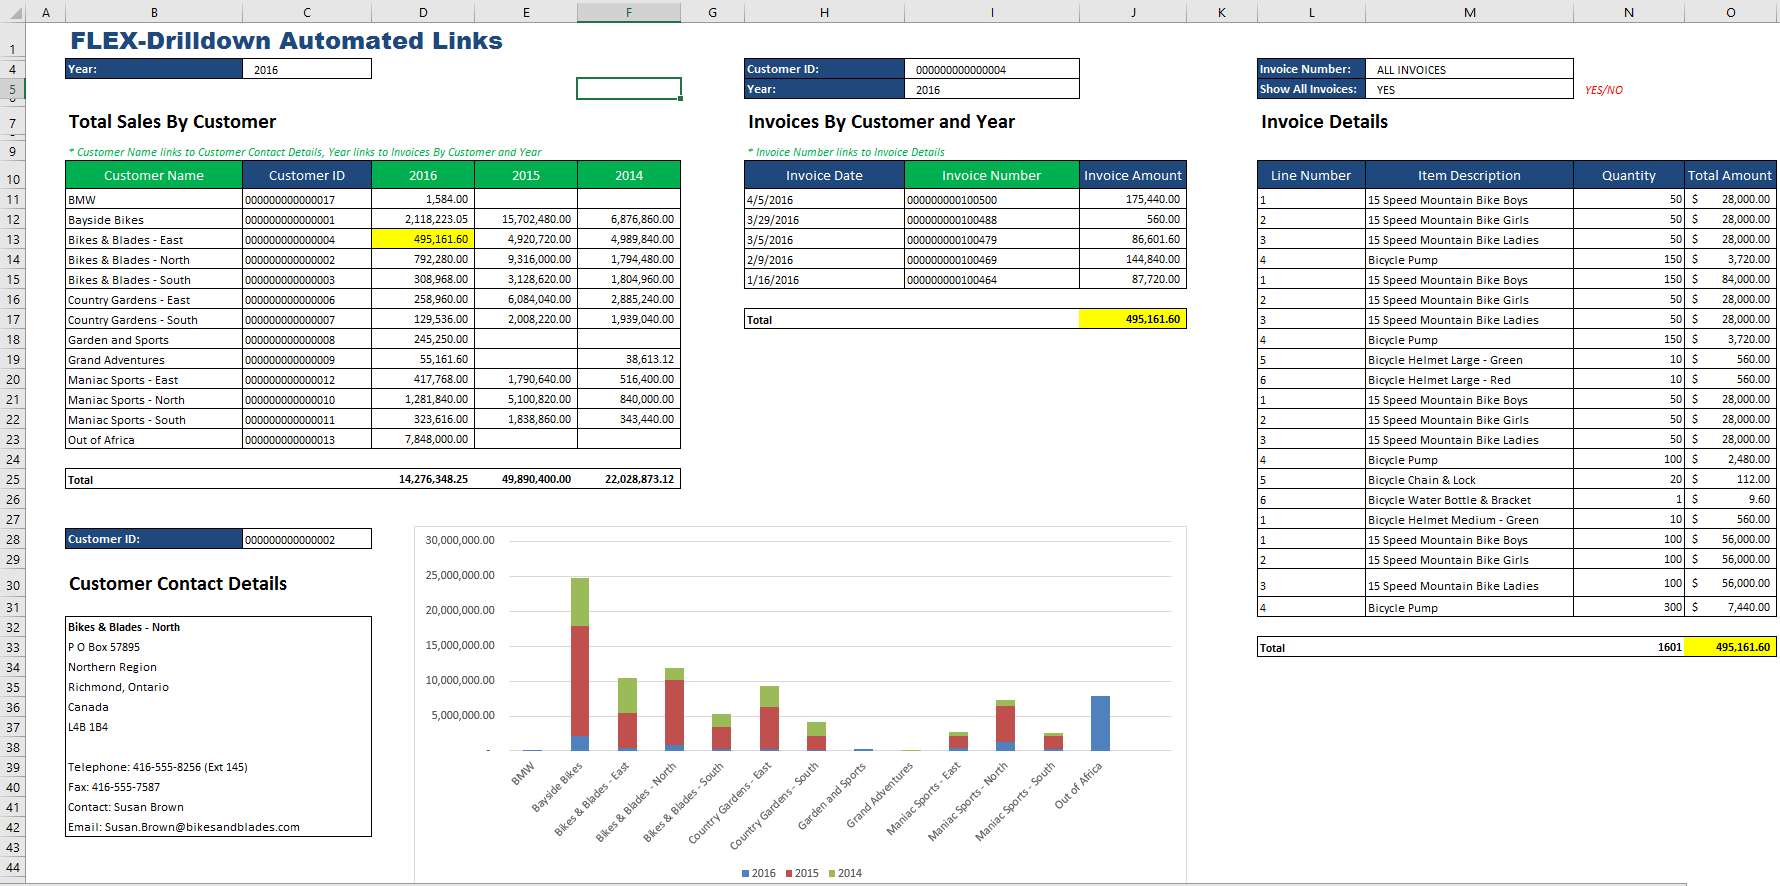
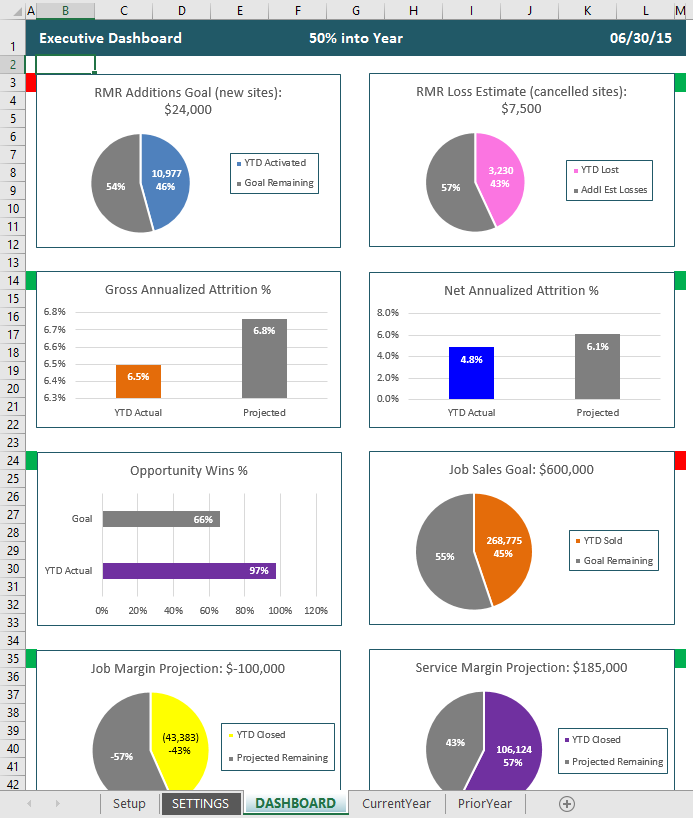
If you are in the accounting or finance department, chances are you already know how to use Microsoft Excel®. It’s one of the most widely used spreadsheet programs, if you have worked with spreadsheets, most likely it’s been with Excel®. You may not know all the fancy and complex functions, but you can create formulas, insert and delete columns and rows, and add text formatting. If you can do all that, you already know the foundation for Excel®-based financial reporting.
2. You can format Microsoft Excel® to your Heart’s content
Do you want your negative numbers to be in brackets and red? Would you like to highlight certain cells that contain certain values? Or perhaps you would like to insert your logo or make your titles be in bold? All of this and more you can do easily in Excel® without any special training.
3. Data Visualization that’s Easy to Understand
Use the data in Excel® to create pie charts, graphs, and certain conditions to add meaning to your data. These can then be used to add visual emphasis to business reports and to make data analysis easier. Most of us can spot trends and notice discrepancies faster when data is visualized compared to when it is presented on a spreadsheet full of numbers.
4. Easily perform ad-hoc Calculations and Modeling
With Excel®, you can quickly copy areas of a worksheet and various reporting elements, calculations, and other data objects to build new reports, templates, and models in minutes. Reports can be changed on the fly and data viewed from new perspectives. What-If analysis becomes extremely easy, especially if the formats are already created and users just need to change a few drivers. Perhaps, you want to quickly make a copy of an entire report, to experiment, or try something new. This is very easily done in Excel®! Analysis has never been easier!
5. Functions and Logic for advanced KPIs and Operating Metrics
Excel® ships with thousands of baked in functions. Even better, finding out which function you want is just a Google search away. By leveraging Excel®, you immediately have access to advanced functions and without having to spend hours learning a proprietary system.
What does this mean for your business and how can Vivid Reports help?
Vivid Reports is Excel®-based. This means that you can pull in your data from your accounting system (and any other databases) and then use the functionality of Excel® (that you already know!) to make meaningful, presentation-ready reports. With a click of a button, you can refresh reports with new reporting parameters, but the formatting and calculations are already set up for the newly refreshed data! You can then share these reports across your company. With Vivid Reports security, you can be sure that users are only seeing the data they are permitted to access. You can also take your Excel-based reports and publish them through Vivid Reports. There, they can be interacted with and consumed over the internet through browsers, phones, and tablets while still preserving Excel formatting. You truly get the best of both worlds with Vivid Reports.
Share: